Financial Indicators
-
Changes in Major Financial Indicators
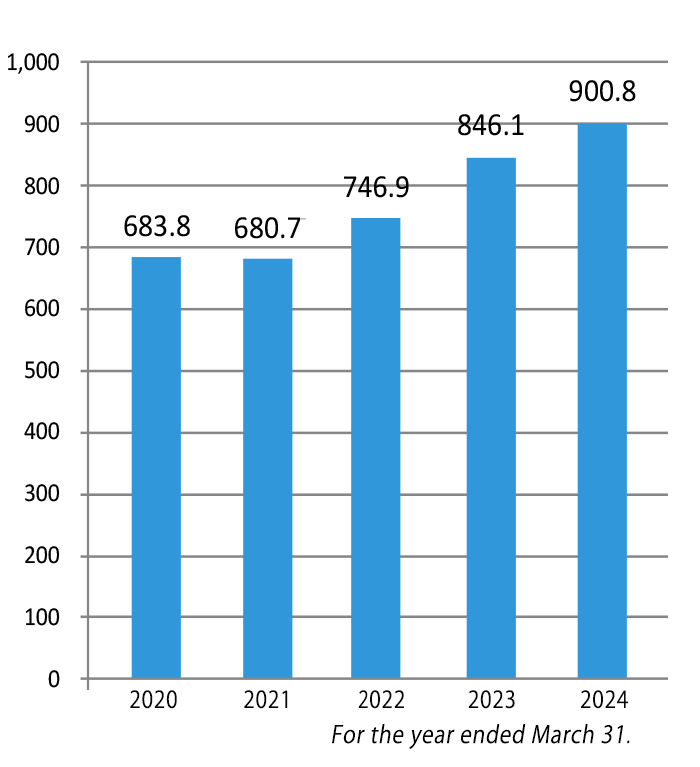
Net sales (billions of yen)
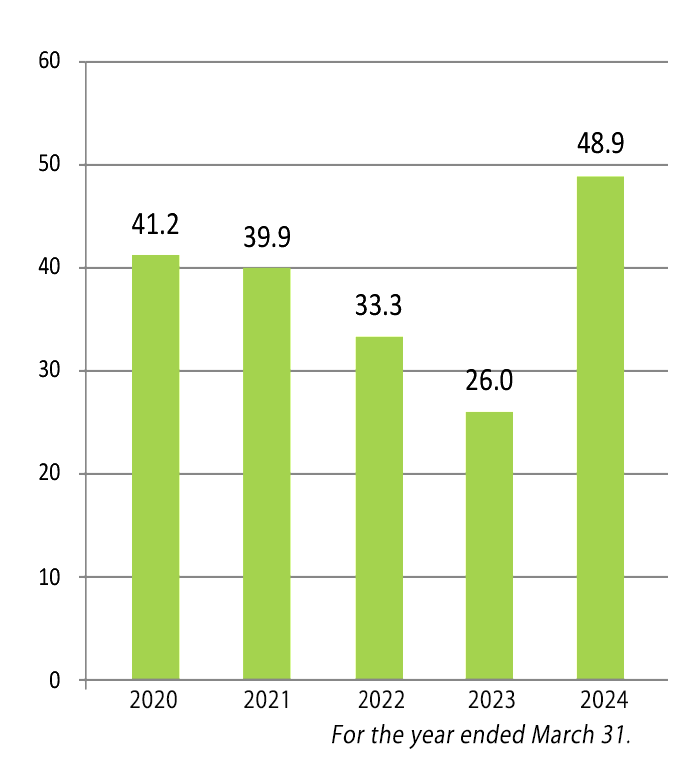
Operating income (billions of yen)
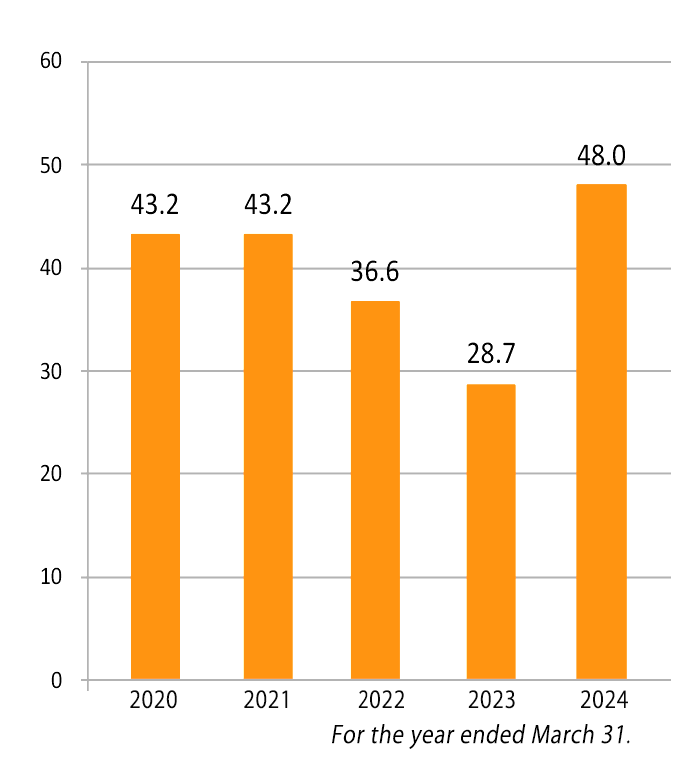
Ordinary income (billions of yen)
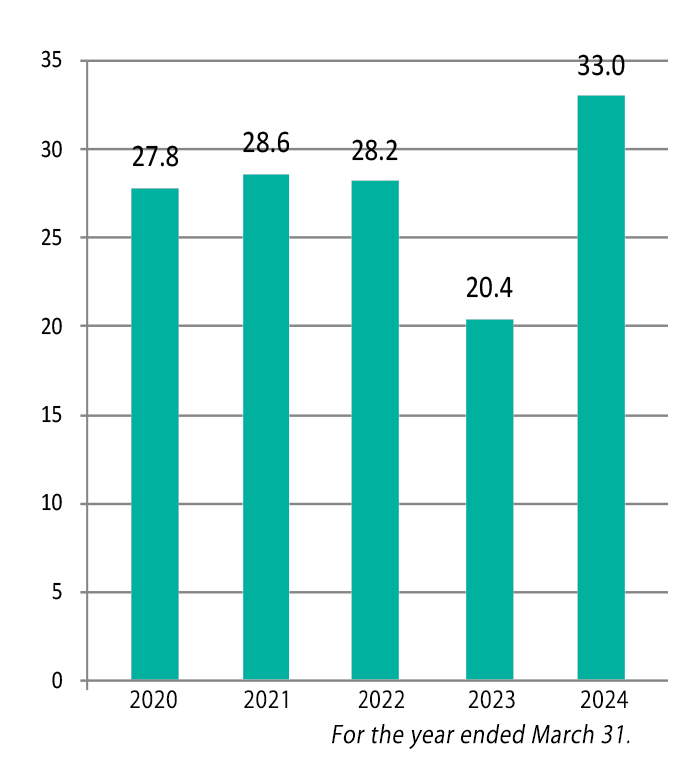
Profit attributable to owners
of parent (billions of yen)
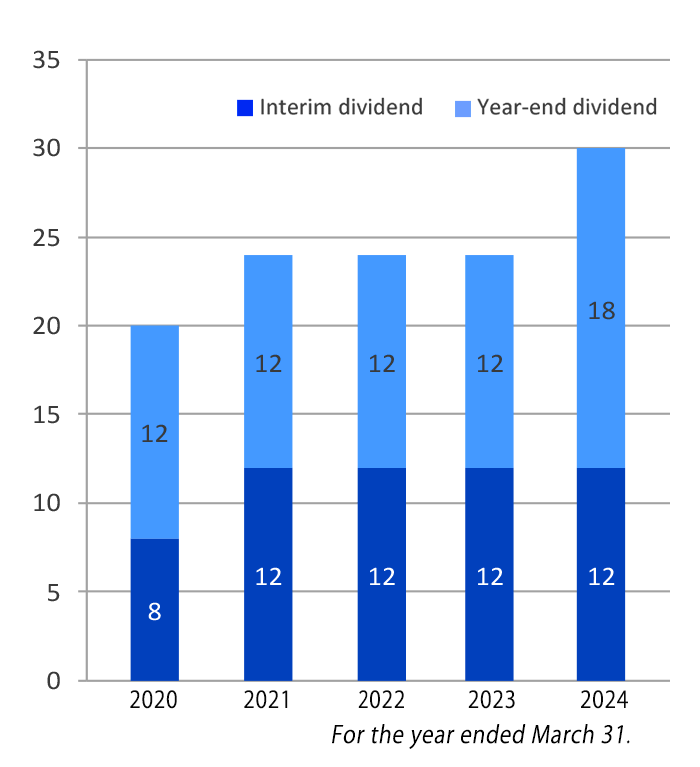
Cash dividends (yen)
Consolidated Performance IndicatorsFor the years ended March 31.20212022202320242025Net sales (Millions of Yen) 680,714
746,926
846,080
900,791
993,251 Operating income (Millions of Yen) 39,938
33,279
25,957
48,855
37,408 Ordinary income (Millions of Yen) 43,20036,641
28,682
47,984
39,178 Profit attributable to owners of
parent
(Millions of Yen)28,59928,18820,42533,02528,979 Comprehensive income
(Millions of Yen)
41,65736,394
37,747
60,415
47,822 Net assets (Millions of Yen) 324,463354,289385,732438,978
500,244 Total assets (Millions of Yen) 869,992934,3451,053,138
1,172,515
1,243,116 Book-value per share (yen) 1,265.531,380.741,505.09
1,716.97
1,872.24 Cash Dividends (yen)
Interim dividend / Year-end dividend12/1212/1212/1212/1815/15Earnings per share (yen) 115.51
113.84
82.47
133.33
116.94 Earnings per share, diluted (yen) -----Equity ratio (%) 36.036.635.436.337.3 Return on equity (%) 9.7
8.6
5.7
8.3
6.5 Price earnings ratio (times) 8.3
6.9
10.4
8.8
6.8 Cash flows from operating
activities (Millions of Yen)66,000
57,893
46,066
89,628
77,008 Cash flows from investing
activities (Millions of Yen)(46,007)(54,680)
(60,646)
(76,033)
(97,283) Cash flows from financing
activities (Millions of Yen)
(7,293)1,86020,02317,265
(14,485) Cash and cash equivalents at
end of year (Millions of Yen)50,09957,83570,912103,78270,551 Number of employees 19,451
20,141
22,548
23,389
25,011